Specialization · Web Applications

Custom Dashboard Development – All Your KPIs Live at a Glance

Revenue in the ERP, leads in the CRM, costs in Excel – and the monthly report is put together by copy and paste. We automatically bring your data together in a dashboard that makes decisions easier.

Initial consultation freeQuote transparent, fixed price if preferredArea Web Applications
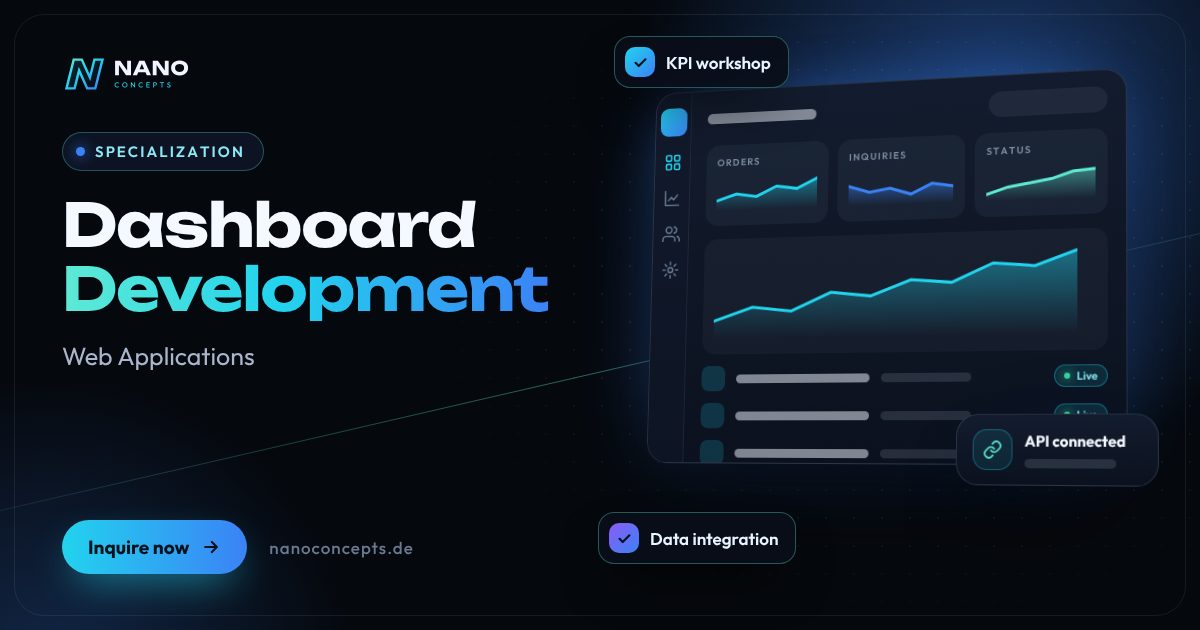
Featured image: Dashboard Development
Short & clear

A dashboard brings together key figures from different data sources – such as ERP, CRM, online store, accounting or Excel – in an automatically updated overview with charts, filters and drill-down. Nano Concepts develops dashboards as web applications with roles and permissions, or prepares data so that existing tools such as Excel or Power BI can use it automatically. Lean dashboards with a few sources are possible in the Starter package from €2,500, more extensive ones with multiple interfaces in the Professional package from €8,000.

Custom dashboard development with Nano Concepts

When you have a dashboard built, it is not about colorful charts but about faster and better decisions. A good dashboard shows at a glance how revenue, incoming orders, inventory, leads or service times are developing – automatically updated from the systems where the data originates. We connect ERP, CRM, online store, accounting, web analytics or Excel files and prepare the figures so that management, sales and the departments each see exactly the key figures they need.

01

At the start is not the technology but a question: Which decisions should the dashboard support? Together with you, we derive KPIs, target values and visualizations from that. Then we take care of the invisible part that decides quality – data integration, cleansing, consistent definitions and an update process that runs reliably. From our work on an AI-powered analytics dashboard for mid-sized companies, we know that clean data matters more than any visualization, however beautiful.

02

Not every project needs custom software. If you already work with Excel or Power BI, we first check whether better data preparation there is enough – for example through a database or interface that feeds your reports automatically. A custom web dashboard pays off when customers or partners should get access, permissions need fine-grained control, or the dashboard becomes part of your product. We recommend the route that fits your data, your users and your budget.

Story

Custom dashboard development in 9 slides

Just swipe through: what Custom dashboard development delivers, what we build for you, and how other companies benefit.

01 / 09

Specialization · Web Applications

Dashboard Development. Built around your workflows.

A dashboard brings together key figures from different data sources – such as ERP, CRM, online store, accounting or Excel – in an automatically updated overview with charts, filters and …

  • Free initial consultation
  • Transparent, fixed price if you like
  • Reply usually within 24 hours
nanoconcepts.de
02 / 09

How you can tell

Does this sound familiar?

Typical signs that Custom dashboard development is worth it:

  1. 01Your monthly report is put together by hand from several exports and Excel files.
  2. 02Meetings are spent arguing about which numbers are right instead of making decisions.
  3. 03KPIs are scattered across ERP, CRM, store and accounting, and nobody has the full picture.
  4. 04Your Excel dashboards are getting slow, error-prone or depend on a single person.
nanoconcepts.de
03 / 09

Your benefit

What you get out of it.

No manual reportsThe figures update automatically – the hours spent copying and pasting into monthly reports …
One shared set of numbersConsistent definitions ensure that sales, controlling and management work with the same …
React soonerDeviations become visible while there is still time to steer back – not only in the …
nanoconcepts.de
04 / 09

Scope of services

What we deliver for you.

KPIs from ERP, CRM, store and Excel in one live dashboard – automatically up to date, easy to understand and …

  1. KPI workshop
  2. Data integration
  3. Data preparation
  4. Interactive visualization
  5. Roles & access
  6. Alerts & exports
nanoconcepts.de
05 / 09

Use cases

Here's what that looks like in practice.

Finance & InsuranceA financial sales organization tracks closed deals, pipeline and commissions per advisor in a sales dashboard.
Industry & ManufacturingA manufacturer sees utilization, scrap and on-time delivery per line in a production dashboard.
Retail & E-CommerceAn online retailer connects store, marketplaces and ad accounts and sees revenue, margin and returns per channel, up to …
nanoconcepts.de
06 / 09

Process

A clear process. No surprises.

  1. 01
    Decisions & KPIsWe clarify who uses the dashboard, which decisions it should support and …
  2. 02
    Reviewing data sourcesWe analyze where the data lives, how clean it is and how it can be …
  3. 03
    Draft with real dataA first draft shows your real numbers – so you see early on whether the …
  4. 04
    Development & reconciliationWe build out the data integration and visualization and reconcile the …
nanoconcepts.de
07 / 09

Common question

Good question. Clear answer.

How much does it cost to have a dashboard built?

Nano Concepts

That depends mainly on the number and condition of the data sources.

All questions & answers
nanoconcepts.de
08 / 09

Packages

Three packages. One plan.

  • Starterfrom €2,500Ideal for landing pages, simple web applications and prototypes.
  • Professionalfrom €8,000For complex web applications, portals and tailor-made software …
  • EnterpriseCustomFor large projects, system landscapes and long-term development …

Non-binding guidance – you will receive your quote after the free initial consultation. View pricing

nanoconcepts.de
09 / 09

Let's get started

Unlock your full potential.

Tell us about your project – we usually get back to you within 24 hours with an initial assessment.

TOGETHER. DIGITAL. SUCCESSFUL.
nanoconcepts.de
01 / 09

Typical signs that Custom dashboard development is worth it

  • Your monthly report is put together by hand from several exports and Excel files.
  • Meetings are spent arguing about which numbers are right instead of making decisions.
  • KPIs are scattered across ERP, CRM, store and accounting, and nobody has the full picture.
  • Your Excel dashboards are getting slow, error-prone or depend on a single person.
  • Customers or partners regularly ask for reports that you compile manually.
Scope of services

What we deliver for you

KPIs from ERP, CRM, store and Excel in one live dashboard – automatically up to date, easy to understand and with drill-down.

KPI workshop

We define KPIs, target values and calculation rules with you so that everyone talks about the same numbers.

Data integration

Automatic connection to ERP, CRM, store, accounting, web analytics or Excel files through interfaces and scheduled imports.

Data preparation

Cleansing, consolidation and storage of the data in a dedicated database as a reliable foundation.

Interactive visual­iza­tion

Charts, tables, filters and drill-down to the individual order – on desktop, tablet and smartphone.

Roles & access

Management, departments, customers or partners each see only the KPIs intended for them.

Alerts & exports

Notifications when values cross thresholds, plus export as PDF or Excel for meetings.

Your benefits

Why companies choose us

No manual reports

The figures update automatically – the hours spent copying and pasting into monthly reports disappear.

One shared set of numbers

Consistent definitions ensure that sales, controlling and management work with the same values.

React sooner

Deviations become visible while there is still time to steer back – not only in the quarterly report.

Access anywhere

As a web dashboard, it is available in the office, on the go and for authorized outsiders without any installation.

Use cases

Custom dashboard development in your industry

Here's what Custom dashboard development looks like in typical industries – concrete examples from everyday business.

Industry & Manu­fac­turing

A manufacturer sees utilization, scrap and on-time delivery per line in a production dashboard.

Learn more

Retail & E-Commerce

An online retailer connects store, marketplaces and ad accounts and sees revenue, margin and returns per channel, up to date to the day.

Learn more

Logistics

A logistics company monitors shipment volumes, transit times and delays per client and provides clients with their own view.

Learn more

Healthcare & Care

A home care provider keeps track of service hours, utilization and open routes per team – with access only for authorized managers.

Learn more

Real Estate

A property management company sees vacancies, outstanding rent and maintenance orders across all properties.

Learn more

Finance & Insurance

A financial sales organization tracks closed deals, pipeline and commissions per advisor in a sales dashboard.

Learn more

Services & Consulting

An agency compares booked and delivered hours per project and sees early on where budgets are running tight.

Learn more

Skilled Trades

A skilled trades business sees order backlog, team utilization and open invoices in a weekly overview.

Learn more

Startups

A SaaS startup tracks sign-ups, active users, cancellations and recurring revenue in a dashboard for the team and investors.

Learn more

Education & Research

A training provider sees registrations, course utilization and completions per location at a glance.

Learn more

Tourism & Hospitality

A hotel connects occupancy, booking channels and average rates in a daily revenue dashboard.

Learn more

Media & Creative Industries

A publisher sees reach, subscription sign-ups and cancellations per section and plans content more precisely.

Learn more
Process

How your project works

  1. Decisions & KPIsWe clarify who uses the dashboard, which decisions it should support and which KPIs are needed for that.
  2. Reviewing data sourcesWe analyze where the data lives, how clean it is and how it can be retrieved automatically.
  3. Draft with real dataA first draft shows your real numbers – so you see early on whether the presentation and calculations are right.
  4. Development & reconciliationWe build out the data integration and visualization and reconcile the values with your existing reports.
  5. Rollout & expansionAfter launch, we train the users and add KPIs as new questions arise.

Technologies & tools

ReactTypeScriptApache EChartsD3.jsNode.jsPythonPostgreSQLREST APIsDocker
FAQ

Frequently asked questions about Custom dashboard development

That depends mainly on the number and condition of the data sources. A lean dashboard with a few sources is possible in the Starter package from €2,500. We implement dashboards with multiple interfaces, a permission concept and customer access in the Professional package from €8,000, and large reporting platforms individually in the Enterprise package – after the free initial consultation.

A first draft with real data can often be seen after a few weeks if the data sources are easy to reach. Most of the effort usually goes into data integration and cleansing, not the charts. We set the schedule after reviewing your data sources.

For internal reporting with few users, a well-built Excel or Power BI dashboard can be enough – in that case, we can feed it with clean data automatically if you wish. A custom web dashboard pays off when customers or partners need access, permissions need fine-grained control or the dashboard becomes part of your product. We advise you without committing to a particular tool.

In principle, anything that offers an interface, database access or a regular export – such as ERP, CRM, online store, accounting, web analytics, ad accounts or Excel files. We check in the first step whether a source can be connected directly.

We define that per data source: from near real time to hourly to daily updates. Not every KPI needs up-to-the-second freshness – a nightly sync is often more economical and perfectly sufficient.

Yes. With a role and permission concept, each customer sees only their own data. That turns internal reporting into a service you can offer your customers.

Solutions

Dashboard Development for your target audience

Related

Related services

Digital Glossary

Terms related to Custom dashboard development, briefly explained

Magazine

Read more

11 · Scenario · approx. 50 seconds

The gut-feeling boss

Three people, three numbers, data from six tools – so gut feeling decides. A live dashboard brings all data together, so everyone sees the same numbers and problems show up before they get expensive.

ServiceData analytics & dashboardsForRetail, wholesale & SMEs
Read transcript

Monday, meeting.
“How’s the month going?”
Three people. Three numbers.
Numbers from six tools.
Export. Copy. Cobble together.
Report done: Thursday.
So gut feeling makes the call.
Warehouse full. Wallet empty.
Here’s what’s going wrong.
Without numbers, you’re flying blind.
NANO CONCEPTS brings all data together.
One dashboard. Live.
The same numbers for everyone.
Problems? You see them before
they get expensive.
Monday, meeting.
Everyone sees the same numbers.
Decisions based on data.

Get the right quote in 60 seconds

Needs analysis: Dashboard Development

Answer a few short questions – we usually get back to you within 24 hours with an initial assessment.

Request a project